Los Angeles - Click for Current
<-Previous Day <-Previous hour Tuesday 12am-1am Sep-10 Next hour-> Next Day->
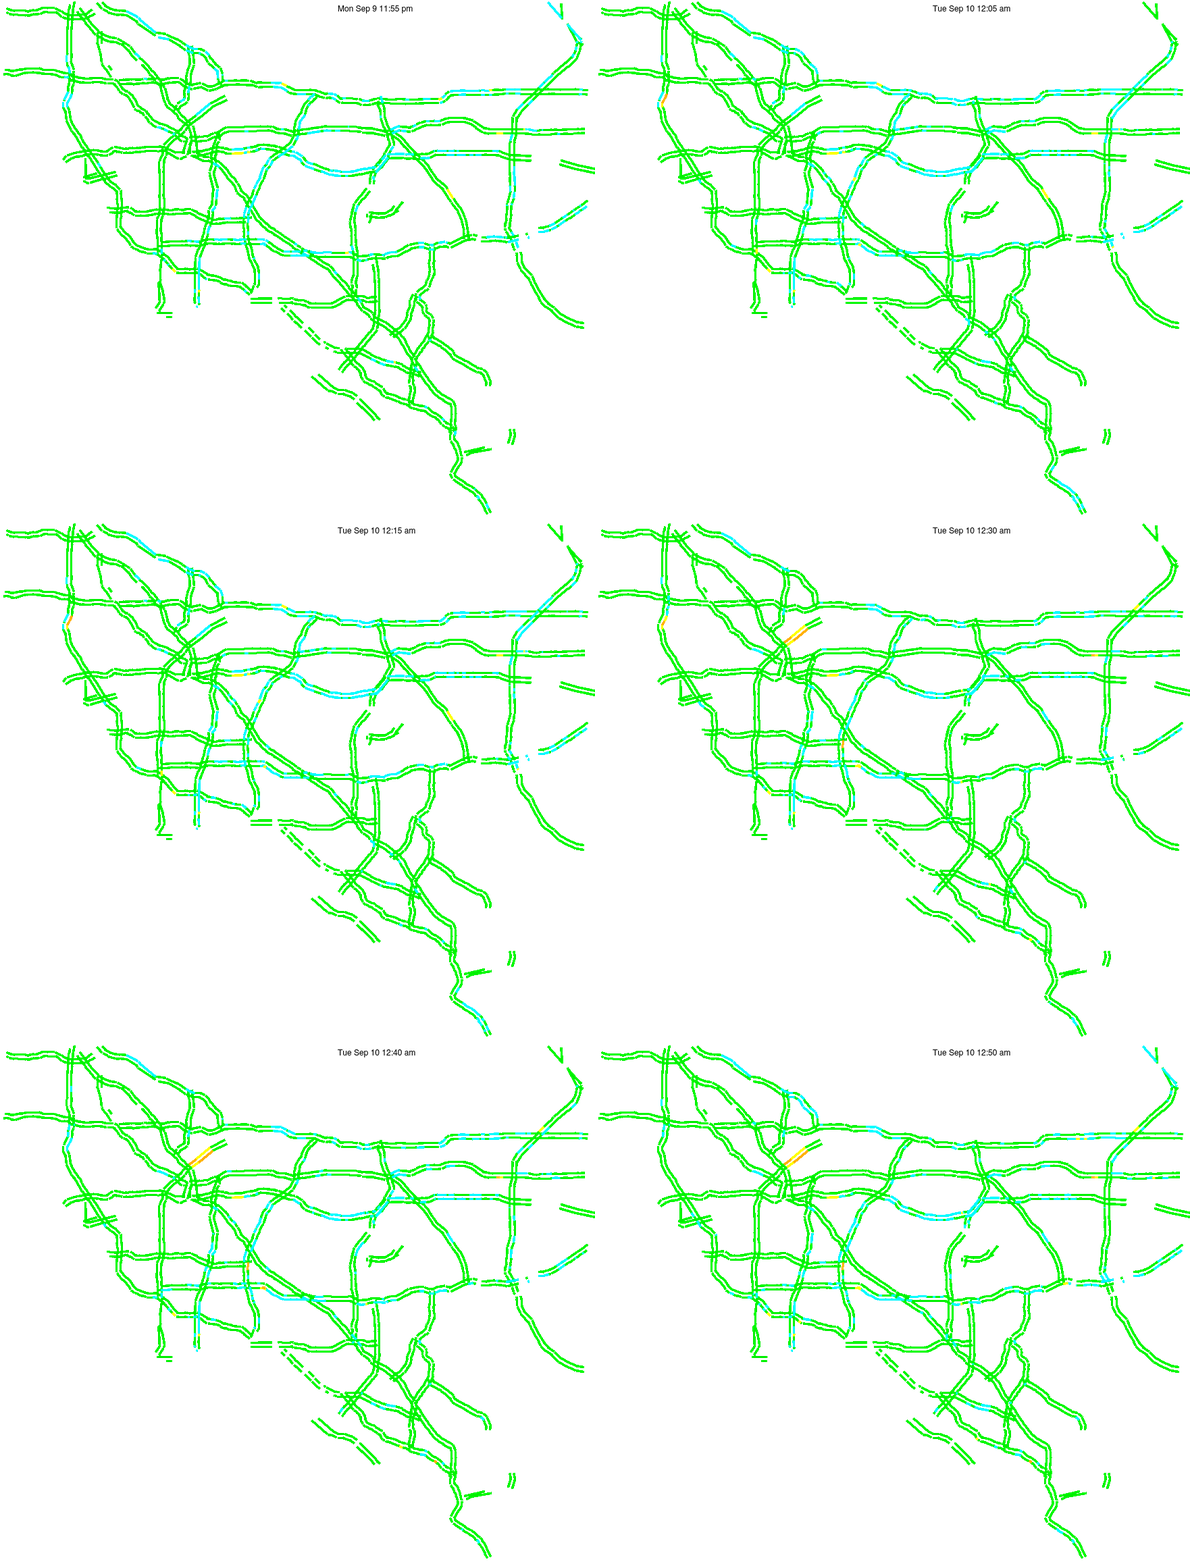
This is a map of historical traffic over 1 hour of time. The colored lines represent speed.
Red < 15 Orange > 15 and < 30 Yellow > 30 and < 45 Blue > 45 and < 60 Green > 60
Powered by OpenStreetMaps